R mcrPioda-1.3.3 package - New M- and MM-Deming regressions
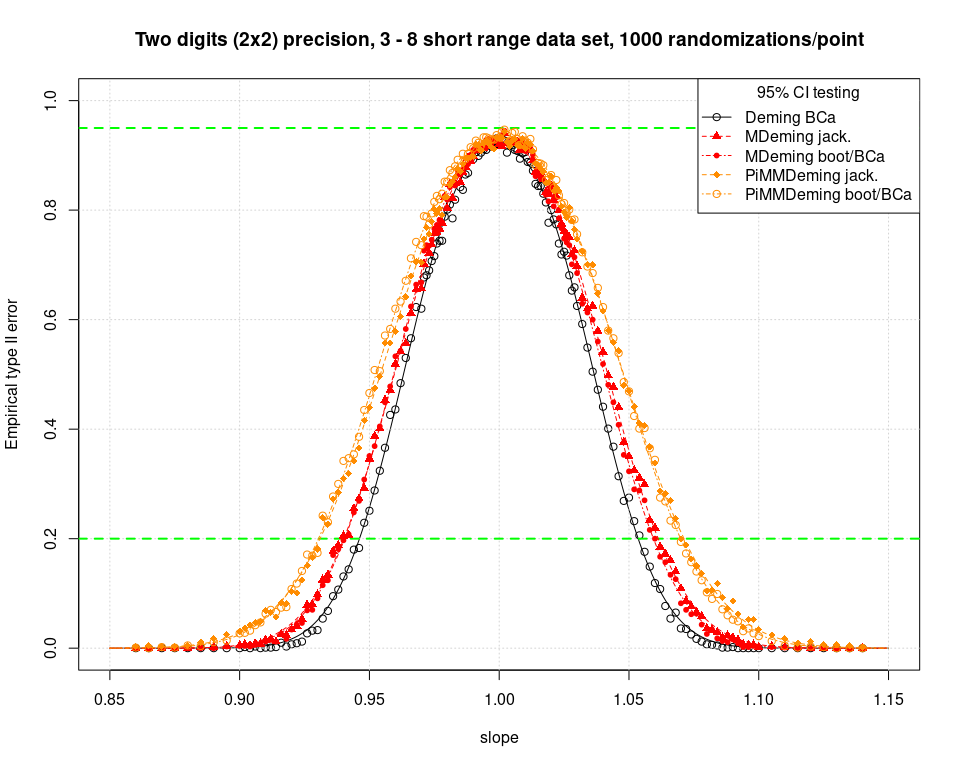
We would like to report the results of a power analysis performed with the new M- and MM-Deming regressions available in the mcrPioda package. As expected the M and MM regressions are slightly less powerful (more conservative) than the non robust classical Deming regression. Symmetry is rather good in all cases; no “Passing Bablok bias” is visible. In general the right side excess (r.s.e.) is better (lower) with the bootstrap/BCa CIs in all cases.
See the tabled data at the bottom of this post for the area under the curve (AUC) and the r.s.e % of each method.
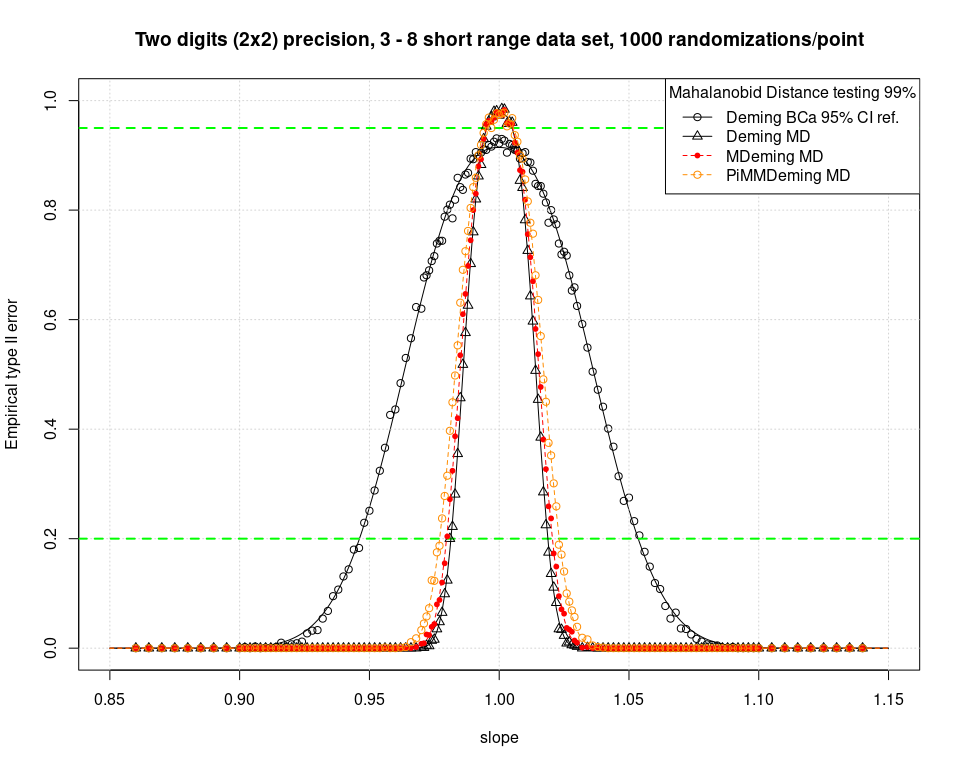
The Mahalanobis Distance (MD) testing on the bootstrap pairs is, as usual, much more powerful. The M- and MM-Deming are again (as usual) more conservative than the non robust Deming regression. The symmetry is very good. The type I error at slope = 1 is smaller with the MD testing compared to the classical CI method; the cusps of the bell shaped curves are higher. This confirms previous results.
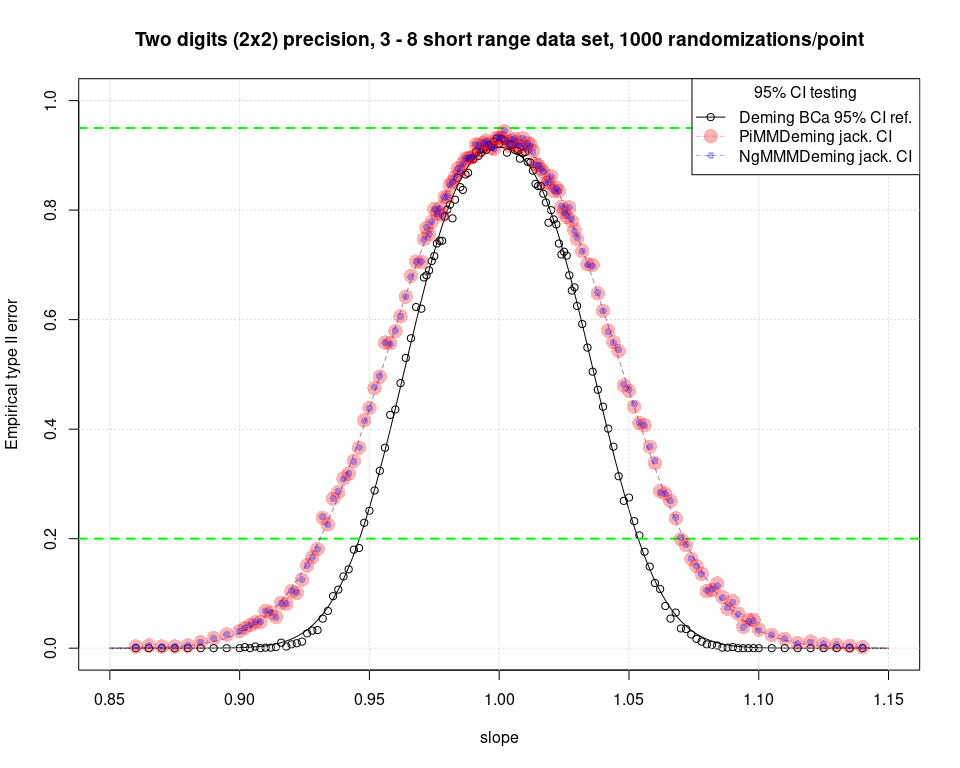
It is worth noting that PiMMDeming and NgMMDeming provide almost the exact same results with the jackknife experiment. This is an indirect clue that the new MM-Deming algorithm does not depend on its iterations starting values. It’s hard to graphically show this fact. For this reason, and expecting a similar result for the BCa experiment, the bootstrap procedure has not been performed with the NgMMDeming regression to spare computing time. The PiMMDeming is in fact some 4-6 times faster than the NgMMDeming.
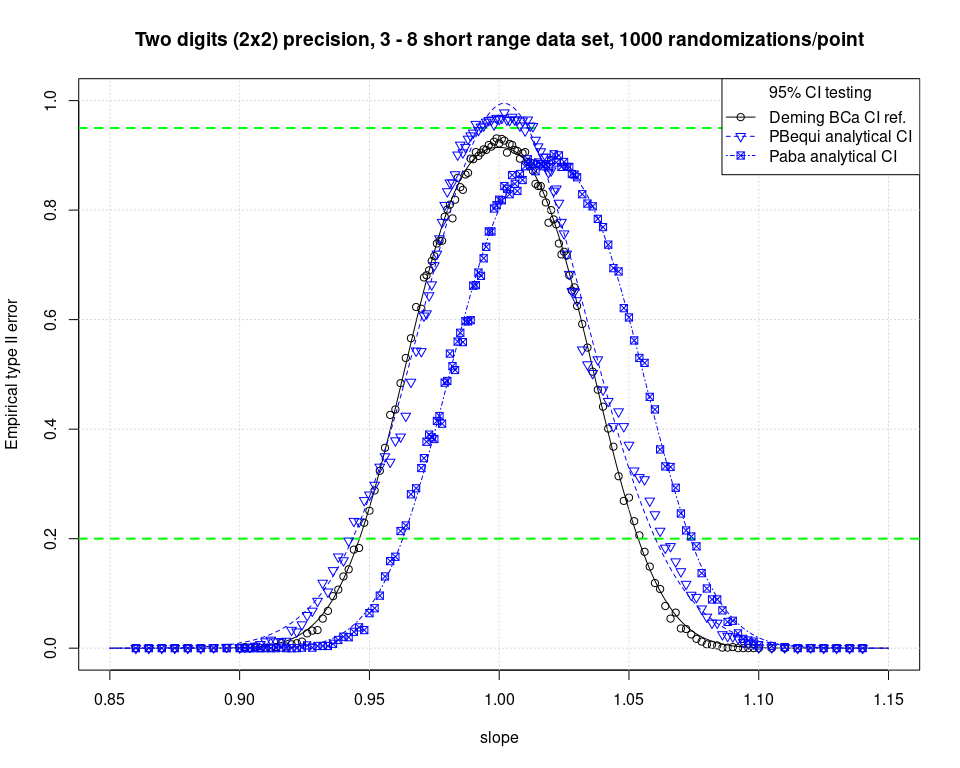
The Passing Bablok family was also, once again, inserted into the test and the usual bias has been once again detected. No bootstrap experiment attempted since it’s known from previous runs that the equivariant Passing Bablok regression do not provide stable enough results to be tested under these Monte Carlo conditions.
Right side excess (r.s.e) and bias
Here below a table of the empirical integrals and of the r.s.e % found for the 13 different methods (10 regressions, among them 3 bootstrap/BCa can be evaluated twice, once for classic CI and once for the MD method)
| Method | right side AUC | r.s.e % |
|---|---|---|
| Deming anal. CI | 0.5066055 | 1.3210965 |
| Deming BCa CI | 0.4985453 | -0.2909385 |
| Deming jack. CI | 0.5066769 | 1.3353888 |
| MDeming jack. CI | 0.5080147 | 1.6029369 |
| MDeming BCa CI | 0.4999662 | -0.0067522 |
| NgMMDeming jack. CI | 0.5112049 | 2.2409829 |
| PIMMDeming jack. CI | 0.5111822 | 2.2364452 |
| PIMMDeming BCa CI | 0.5009694 | 0.1938732 |
| PBequi anal. CI | 0.5278725 | 5.5744966 |
| PaBa anal. CI | 0.7128449 | 42.5689747 |
| Deming BCa MD | 0.5028622 | 0.5724476 |
| MDeming BCa MD | 0.5041070 | 0.8213957 |
| PiMMDeming BCa MD | 0.5036048 | 0.7209574 |
In general jackknifed and analytic CI show higher r.s.e than bootstrap/BCa CI and the bootstrap method is the most symmetric one. Very good symmetry is found for the MDeming bootstrap/BCa. The MM methods paired with jackknife CI show a r.s.e % that is not really satisfactory, but the PiMMDeming paired with bootstrap BCa delivers a low r.s.e %. In general Mahalanobis Distance testing shows also good symmetry and low r.s.e%. All Passing Bablok methods are confirmed to be biased towards slopes higher than 1 (high up to very high r.s.e% are present) and should not be used with limited precision data sets.
About this experiment
This Monte Carlo experiment follows the path showed in 2021. The data set generating function is the original one for rounded data. The slopes are tested at 147 different levels. In the range 0.97-1.03 the slopes density is 0.001, in the range 0.9-0.97 and 1.03-1.10 is 0.002 and for the most external values the density is 0.005. For each slope point 1000 data sets were randomly generated and tested with each of the 13 different methods. Thus the registered differences lie in the methods properties and not in the random data generation.