Bias with AUC - PBequi, PaBa, Deming, MDeming, MMDeming
A new simulation was performed to check the potential bias of the equivariant PaBa regression. Having only 1 bootstrap to perform, it has been possible to raise the number of replicas to n = 1000. Additional curve points to have a better image have been added (81 points vs 71). The following methods were analysed on the same run.
- Deming - Analytical CI
- Deming - Bootstrap BCa CI
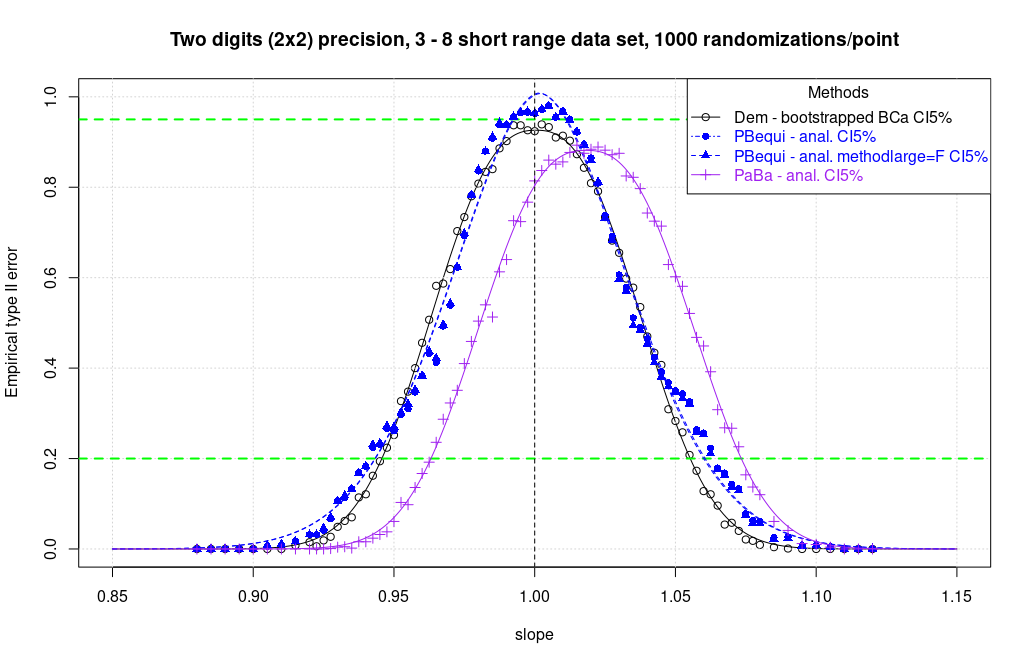
- PBequi - analytical
- PBequi - analytical, methodlarge=F
- MDeming - Jackknife CI
- MMDeming - Jackknife CI
- PaBa (classical) - analytical CI
Of the methods tested, the only one that proved to be perfectly symmetrical was the Deming regression with CIs calculated with bootstrap BCa. All other methods have a bias. For some is slight, for others less slight and instead very marked for classical PaBa missing the correct slope peak of about 2%.
The graph shows a marked asymmetry on the right-hand side of the curve for the PBequi methods. There is a strange hump at the slope of about 1.05.
For the PBequi regression, it is also striking that it was not even possible to perform the test in combination with the CIs calculated with jackknife. The algorithm is apparently not stable. It was fortunately possible to run a preview with n=50 and from what little we can see, it seems that the problem really lies in the method itself and not in a computer problem. In fact, with slopes of 1, too many regressions are rejected. See the image below in this regard.
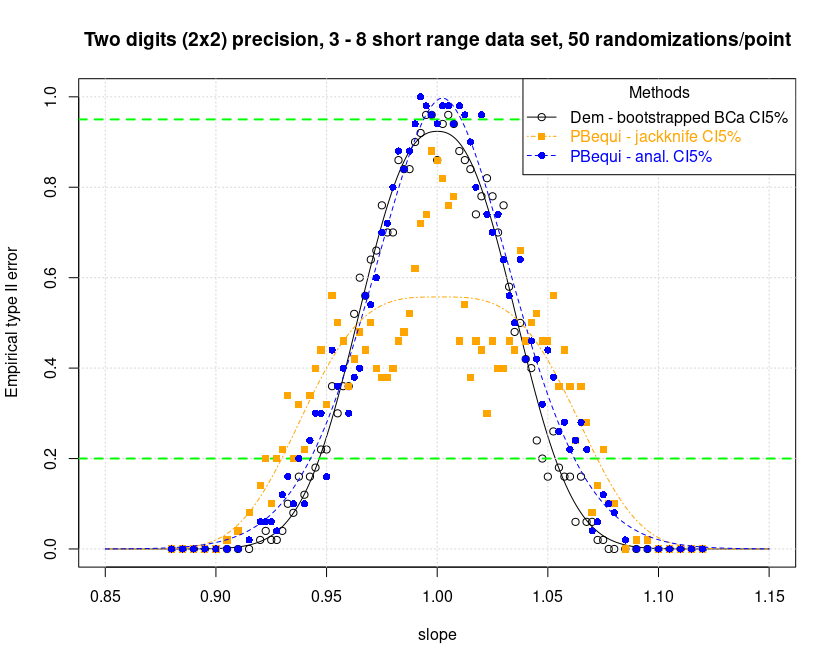
It is assumed that there may be a role for ties. The impossibility of testing bootstrapped methods has already been reported previously.
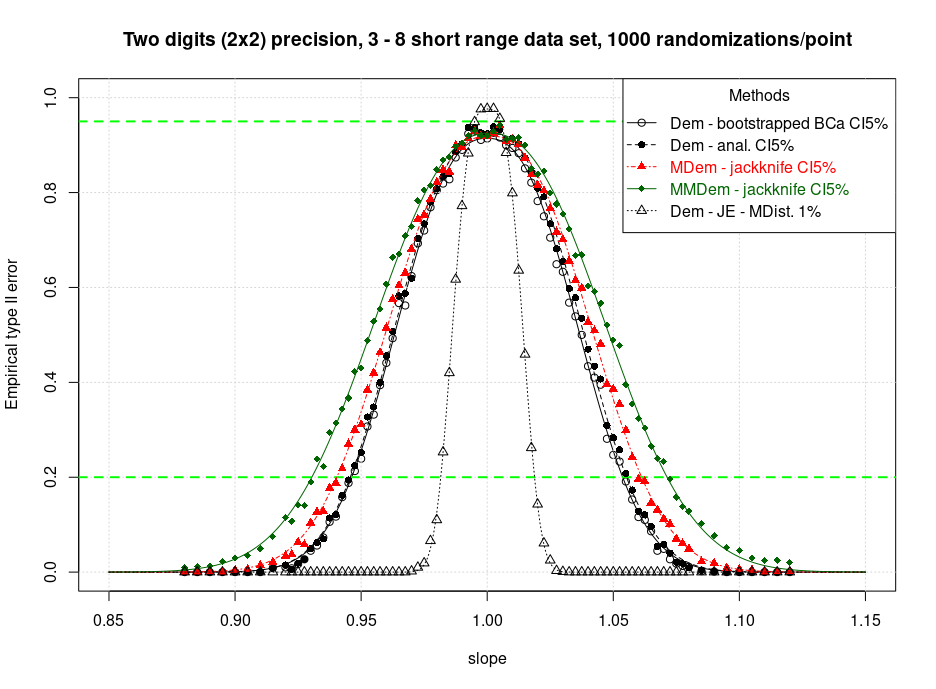
M-Deming seems to be much more symmetrical. It is also a little more conservative. Here below a comparison of M-Deming (jackknife CI) together with other methods. The most robust method, MMDeming, is the most conservative. With MMDeming a strong outlier receives a weighting factor of zero and is totally ignored. (In PaBa an outlier still moves the rank of the pairwise calculated slopes.)
A second run at n=1000 for reproducibility is going to be performed very soon.
From the first integrations (AUC() from {DescTools} package, full numeric integral, no non linear regression) it seems that the integral proportion ratio between the right side of the curve [1;max) and the whole curve [min;max] is about 0.49972 for bootstrapped Deming BCa, 0.50572 for JE/MD Deming, 0.50575 for analytical Deming, 0.50943 for MDeming jackknife, 0.51086 for MM-Deming Jackknife and whopping values of 0.52213 for PBequi methodlarge=F and 0.52669 for the default PBequi. Analytical PaBa is out of contest with 0.71375 with no surprise.
Borrowing the concept of enantiomeric excess (e.e.) from chemistry we may state that the right side excess is -0.056% for BCa bootstrapped Deming, 1.14% for Deming JE/MD, 1.15% for analytical Deming, 1.89% for MDeming Jackknife, 2.17% for MMDeming Jackknife, 4.43% for analytical PBequi (methodlarge=F) and 5.34% for default analytical PBequi.
More precise data with AUC integrals and mu coefficient estimates will follow.