Bayesian Deming regression, Type I (alpha) error
Mahalanobis distance test
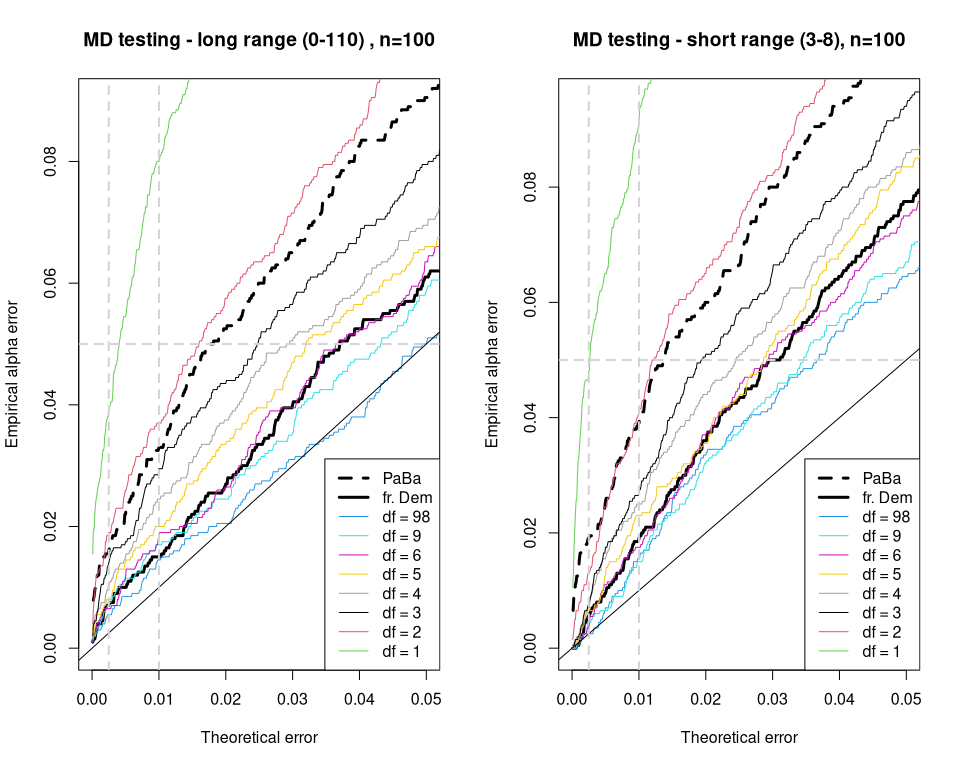
In order to apply the Mahalanobis distance (MD) method when carrying out a method comparison (bdpPlotBE() in {rstanbdp} R package), it is necessary to set a probability threshold P-value. Through simulation in 2021, it was reported that a P < 1% level is a good choice, as 5% is not enough conservative. The same approach is now repeated here with the Bayesian Deming regression. The experiment is performed with 2000 randomly generated data sets. For comparison, classical frequentist Deming and PaBa were performed with bootstrap / BCa CI method to obtain the necessary intercept and slope pairs.
As shown in the P-P plot above, the choice of P < 1% is still valid for the Bayesian methods, except in the case of the regression performed with df=1. For this one 1% is not enough conservative and, at first glance, a P < 0.25% could be considered as a meaningful choice (see grey dashed levels).
Worth noting, the non-robust (df=98) Bayesian Deming regression follows the ideal probability line rather well for the long range data set and less well for the short range data set. In both cases it follows the ideal P-P line better than classical frequentist Deming regression.
The Bayesian Deming regression performed with df=6 or df=5 gives similar MD testing results as the frequentist non robust bootstrapped Deming regression. The MD results obtained with the bootstrapped PaBa regression gives similar results as the results with the Bayesian Deming regression at df=2.
The Bayesian Deming regression with df=1 seems to be a regression of an its own category. If the non adherence to the P-P plot is a sign of robustness, the regression at df=1 is much more robust than the original PaBa algorithm.
Classical CI test
The classical 95% CI testing (via bootstrap/BCa CIs) has been also subject to the simulation experiment to verify the empirical rejection ratio. Here below the total acceptance rate is reported. It’s worth noting that the 95% level is never really met even with frequentist Deming and classical PaBa. The FWER is not managed and in general the total rejection ratio is always higher than what it should be, as already previously reported in 2021.
##          dem.tot bd.tot bd9.tot bd6.tot bd5.tot bd4.tot bd3.tot bd2.tot bd1.tot
## short100   0.930 0.9355  0.9320  0.9245  0.9235  0.9160  0.9105  0.8935  0.8580
## long100    0.914 0.9260  0.9255  0.9195  0.9145  0.9125  0.9010  0.8880  0.8265
##          paba.tot
## short100    0.933
## long100     0.921
The Bayesian Deming regression is here again more conservative than the equivalent frequentist Deming regression. The robustification leads to the fact that the Bayesian Deming run with df=5 shows a similar Type I error than the frequentist regression. At lower df the CI get less conservative. Further investigations are needed to asses a meaningful P-value for df=1.
With the binomial distribution it is also possible to calculate the CIs of the empirical rejection/acceptance ratios. The CI for the reference frequentist Deming total acceptance are calculated with binom.test() and printed here below:
##          ratio       LCI       UCI
## short100 0.930 0.9179247 0.9407952
## long100  0.914 0.9008472 0.9259235
Comparing these LCIs with the ratios above is pretty clear that df=5 is a safe choice and if data span on a long range also a df=3 setting can still be seen as valid alternative without any P-value correction.
Preliminary conclusions
With the actual knowledge is it seems to be pretty safe and standard to use df=2 and P < 1% for the Mahalanobis distance testing and df=5 and P < 5% for the classical CI testing when robustness is desired within the Bayesian Deming regressions family.